Interactive dashboards
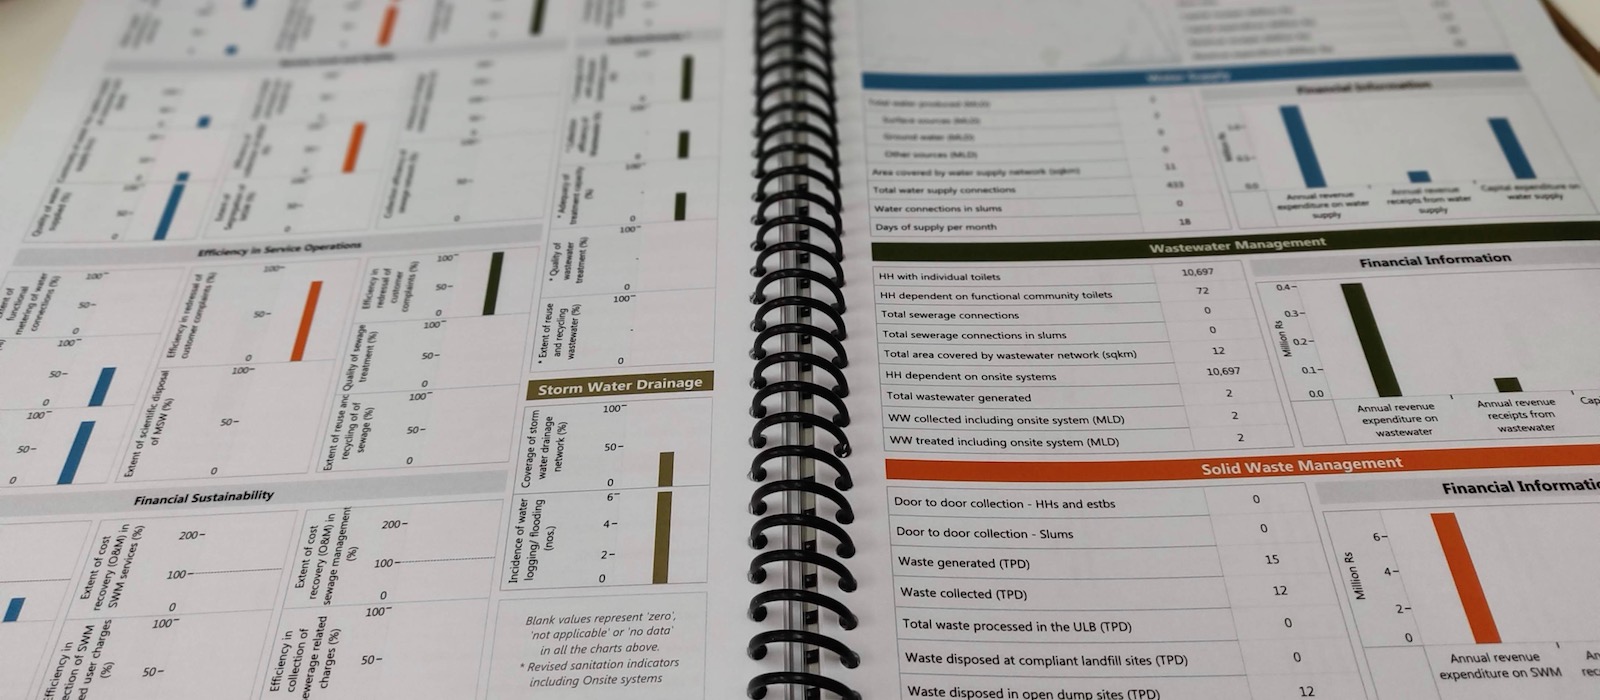
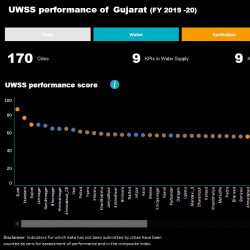
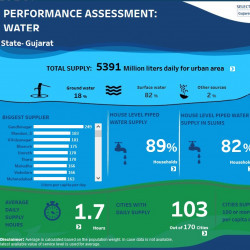
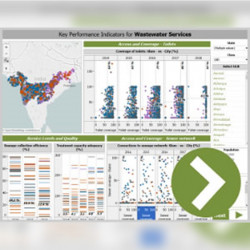
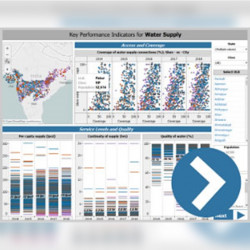
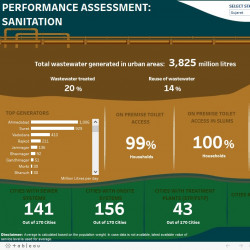
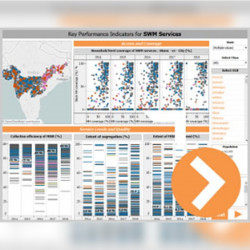
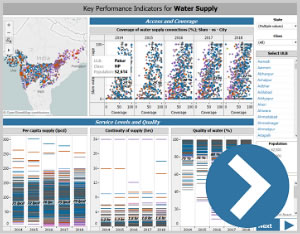
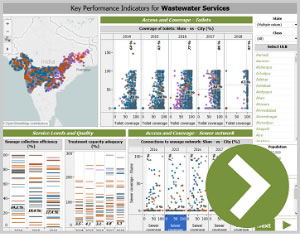
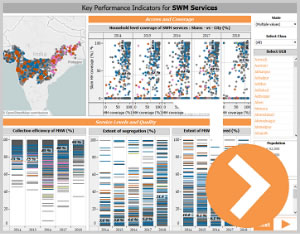
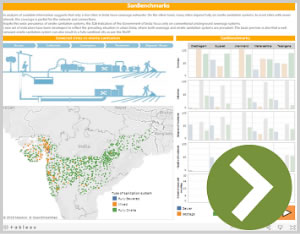
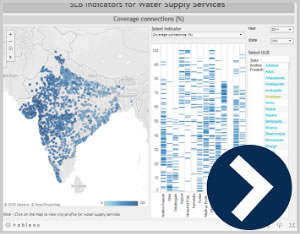
To view the performance assessment results, various interactive dashboards have been designed and developed. These dashboards provide insights and a wide range of technical analysis. They provide aggregate value at the state level as well as specific performance snapshots of cities. From state analysis to city performance results can be viewed quickly through interactive dashboards. It allows drilling down from indicators, charts and maps to read the data better. The dashboard also allows assessment of the levels of performance around which cities cluster.
